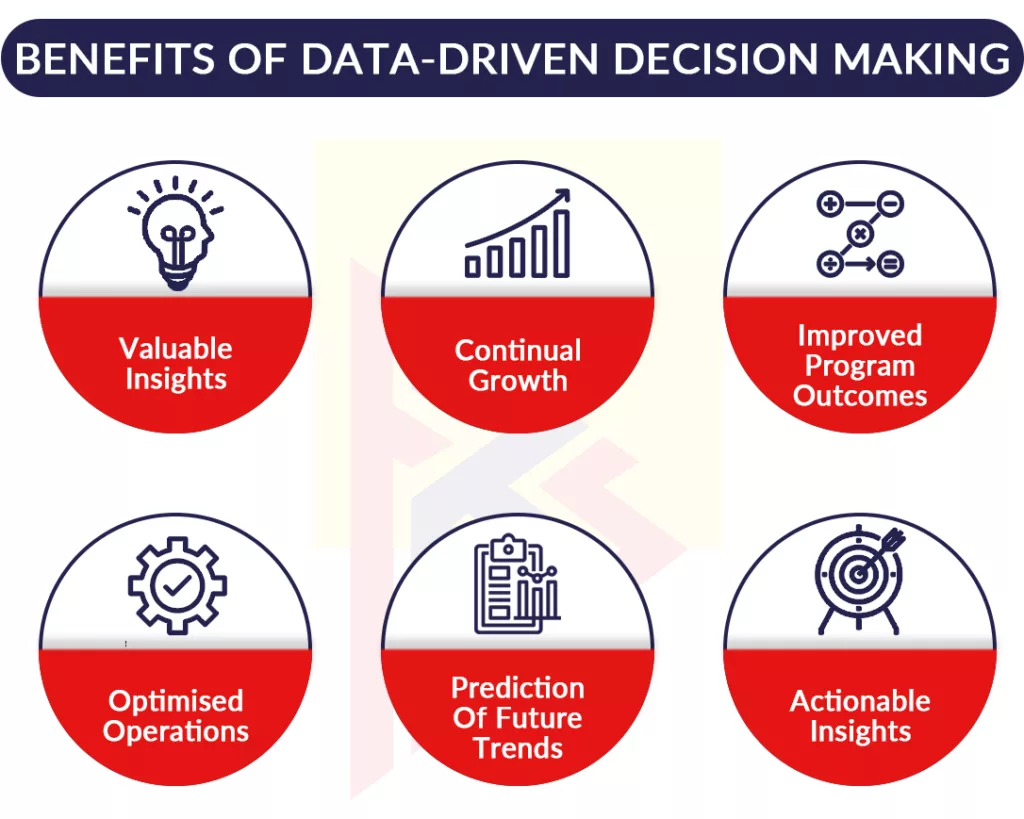
Power BI may be attractive to those who want to integrate multiple data sets and streamline their reporting processes. Above all, though, most organizations seek to utilize analytics to boost performance.
You can get your employees working together on a sophisticated platform and manipulating data with Power BI. Analyzing trends and making predictions can be easier when you combine insights from historical and real-time data. It provides you with the information you need to make informed business decisions, whether it’s broad process improvements or granular daily operations.
What is Power BI and How Does It Work?
In addition to providing analytics and reporting, Power BI is also part of Microsoft’s cloud offerings. Companies can use it to gather data from various sources in a centralized location. A platform offering hundreds of options to visualize data and create reports. The harmony between the data allows users to perform analytics and provide insights into company performance across departments. Customized dashboards let you manipulate these visuals, find insights, share reports, and collaborate from anywhere.
Making powerful decisions with Power BI is so simple that anyone at a company can take action based on insights.
Why Use Power BI?
The popular business intelligence tool Power BI is gaining in popularity every day. And its functionality is always improving. We work so radically differently these days, and the importance of real-time analytics has risen to the forefront, Microsoft continually updates its platform to meet the needs of today’s employees.
Top 10 Features of Power BI

Quick start
It takes no time at all to sign up and begin with Power BI. Using the platform, you don’t have to be a data mining expert or a trained analyst – its simplicity makes it easy to start using right away. To create powerful visualizations, it is important to learn some additional skills as you go along. In contrast, from the content recipient’s perspective, the dashboard will still be easy to read despite its complexity.
Interactive Q&A
Natural language queries allow you to easily ask questions about your data and receive an appropriate visual response.
Read why Golang is the best language for AI?
Print dashboards
To present your results during a meeting, is it necessary to have your dashboard on paper as well? That’s no problem. You can print it and it will still be good as new.
Custom visuals
Use visuals SDK to create custom visuals from scratch, which can then be certified by Microsoft and published on AppSource. You can also get help from software developers for this step.
Real-time streaming

You are immediately informed when something changes. Dashboards allow for real-time reaction and issue resolution.
Organizational content packs
It can be used to share Power BI assets (such as dashboards and reports) within your organization.
Data Analysis Expressions (DAX)
You are able to prepare data models for discovering hidden yet valuable information using DAX libraries that support deep data manipulation.
Read which one should you select amongst Iconic or React Native for your next project, in our detailed blog.
Mobile features
Android, iOS, and Windows devices can be used to access Power BI anytime and anywhere.
Integration with your app/service
PowerBI provides a REST API that can be used to integrate your own apps and services.
This toolset enables you to create actionable and useful visualizations, along with many other features within the platform. You can use these dashboards for a variety of purposes while maintaining full control over your department, organization, or project. Take a look at the following examples.
Organizations Choose and Love Power BI because:
The platform is Easy to Use
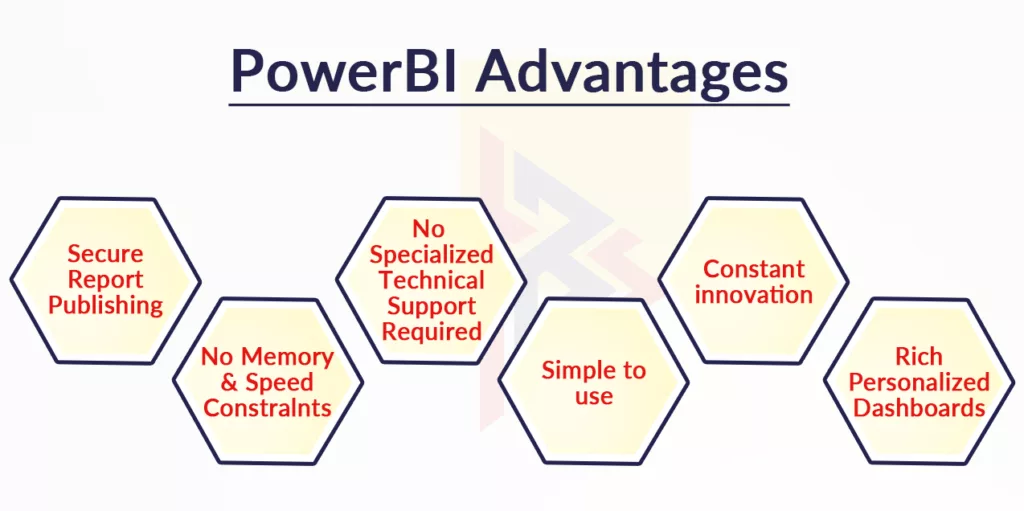
The platform is easy to use for beginners and experts alike. You can get started using it right away.
Analyzing doesn’t require any special expertise. Analytics can be used in business reporting, planning, and decision-making processes every day through the creation of a data-driven culture. In addition, Power BI has been designed in a way that makes sense to Microsoft users, especially those familiar with Excel.
Dashboards are customizable

Design the dashboards easily so that users can keep track of metrics that matter to them. Individuals, teams, or departments can customize their dashboards as needed. Data can be customized for each user, connected to their preferred visualizations, and shared and collaborated with within the platform effortlessly. User time can be spent on information that is relevant to them, making it more efficient and actionable.
Data Processing is Powerful
The power of Power BI is that it can pull huge quantities of information from multiple sources seamlessly. By unifying your data across departments and locations, you can streamline operations in both on-premises and cloud environments. Sources that fall under this category include Dynamics 365, SharePoint, Excel, Azure SQL Server, and other cloud and on-premise data sources. In Power BI, you can use simple, Excel-like tools to transform and model your data.
Read about the best ASP.NET Tools for development.
Visualizations are Compelling
Hundreds of visualizations are available for building attractive, compelling visuals and reports. It is possible to perceive and understand data differently based on how we view it. Creating visuals that reflect the user’s own emotions can allow them to send themselves a message through their own design. Additionally, share the information easily for presentations. Visual cues allow users to clarify messages, defend decisions, confirm results, and stimulate action.
Insights are Actionable
Data displayed cohesively and visually will make identifying opportunities to improve and transform your organization simple. There are so many ways to optimize things, and they range from logistics to operations to employee performance.
Machining learning capabilities are even available in Power BI for making business forecasts. Quick insights, Q&A, and other features can point you in the right direction if you are not sure where to begin.
Our data will allow you to make the best decisions for your organization based on the latest, most accurate information. With the ability to respond swiftly in uncertain times, you’ll be able to cope when things go wrong, or when they go right.
Read about the Healthcare trends of 2021, here in this blog.
Moreover, the actionable insights you and your team will receive won’t be exclusive to you. Your operation will be able to see everything from all angles if this is placed in the hands of team members and individuals.

How are Companies Using Power BI?
Companies around the globe use Power BI to solve problems, optimize processes, and achieve new goals.
Real-time Visualization
Users could access interactive visualizations from news organizations. In addition, you can access county-level results with Power BI. In addition to frequent data refreshes, visualizations show real-time results.
Control Over Disparate Data
Condé Nast in 2013 started managing data analytics across multiple brands with Power BI. Additionally, they wanted to improve their abilities so they could be proactive in sending brands helpful insights.
Marketing analytics was previously managed using several tools, so there were inefficiencies and shortcomings. Through Power BI, they easily obtained insights they could use to make informed improvements to their brands’ performance.
Enhanced, Unified Reporting
By using Power BI, Banfield Pet Hospital transformed its inefficient reporting processes that required employees to enter time-consuming data and limited executive access to company data. More than 1,000 locations now have sophisticated, uniform data visualization instead of static Excel spreadsheets and PDFs.
With real-time visibility into the business, executives have gained a better understanding of it. Analyses and collaboration can be utilized by individual locations to improve operations, patient care, marketing, and finance.
Artificial Intelligence made easy with Power BI
No matter where you work in an organization, Power BI has lots of “power” you can utilize. Get the most out of Power BI AI with the following features:
Azure Cognitive Services in Power BI:
Automatically detecting positive or negative sentiment from documentation, images, and social media can be achieved using these services. Analyze the data that comes from a variety of sources by Azure Cognitive Services using machine learning models. These algorithms analyze organization names and locations.
Using these AI capabilities, decision-makers can automatically react to positive or negative customer reviews. These AI and machine learning features can ensure a successful operation and customer satisfaction for owners of restaurants all over the world. Power Query Online – the dataflows editor in Power BI – provides access to cognitive services via the AI Insights browser.
By using Power BI, businesses can tap into insights without having to hire experienced data scientists. The tool works with multiple data sets, creates queries, tests them, and displays visualizations designed to capture key insights.
Key driver analysis:
By assessing the collected data based on the key drivers, Power BI users can determine what drives a given outcome, rank the data based on importance, and analyze the key drivers. The new feature adds another piece to the puzzle by allowing key stakeholders to better understand how, when, and why certain things happen in the company.
Keeping ahead of the competition and growing the business require such intelligence. In turn, the organization can determine what are the most important action items to grow based on this analysis. Therefore, an analysis of key drivers for growth provides insight into how to improve internal and external business performance.
Automated machine learning (AutoML):
Because of your lack of coding skills, do you think you’ve hit a roadblock? Without having to write a line of code, users can create machine learning models with Power BI! The platform will choose the algorithm and required features for you based on how the analyst wishes to apply the model. You need to do your job better rather than harder. Anyone in the organization can use Power BI to gain insights into business opportunities and goals.
Automated machine learning leaves no questions unanswered. Summarise the ML models in an AutoML model report along with key influences when predicting specific outcomes with the ML model. Pretty cool, huh? Better yet, users can schedule a refresh with Power BI so that the latest predictions are based on the most up-to-date data. An additional report also evaluates how accurate the ML model is.
Users have the capability to select the type of model that they want to use from columns from a dataset. As a result, you can select the values to appear in the resulting predicted classification using Power BI and AutoML.
Conclusion
Ultimately, Power BI’s AI brings business optimization to a whole new level. The more automation, or automation implemented through a platform, you are able to collect and analyze analytics that would otherwise need human intervention, how many hours can you save? Saving time saves money! By using dataflows, Power BI allows users to have a great deal of flexibility: instead of developing new systems from scratch, users can take advantage of query-building techniques to construct reusable data entities without having to learn the underlying technologies.
You can easily integrate Machine learning into business applications without writing code using Power BI. Built Machine learning libraries on Azure, and Power BI enables their use in BI applications.
In addition to its AI capabilities, Power BI’s AI features free up resources to do other tasks that you normally delay or postpone. By combining AI with automated features, businesses can improve efficiency and build intelligence at the same time.
AI helps with providing quick insights, exploring data, and identifying patterns in an easier way to drive improved business results. In order to stay competitive in any industry, you must stay on top of your game – and Power BI allows you to do just that.
There are so many possibilities with Power BI, and the possibilities are constantly expanding. For more information about how this powerful analytics platform can benefit your business, contact one of our experts.
